DE / EN
Home > Student work

Datenvisualisierung - Daten erfahren

How an idea is born / First Idea Sketches by Mishela Atanasovska

designinno

Spring Semester || Fourth Semester || Prof. Jakob Lehr

Data Visualization

What is data, and how is data relevant for graphic designers? With this question as a starting point, students attending Datavis explore approaches to data gathering and visualization.

Where can I find interesting data? How can I visualize my data truthfully? What visual approaches should I use for my data? Research and practical work are the focal point of this course. An eye-catching and informative B1 poster — a print product — is the final result.

In-class teaching and experiments are supplemented by excursions to inspiring institutions. Past courses included visits with Berlin-based Datavis company Datawrapper and Funke Interaktiv, the datavis branch of Funke Media, a large German newspaper publisher.

Anything goes / Free Choice of Data Subject

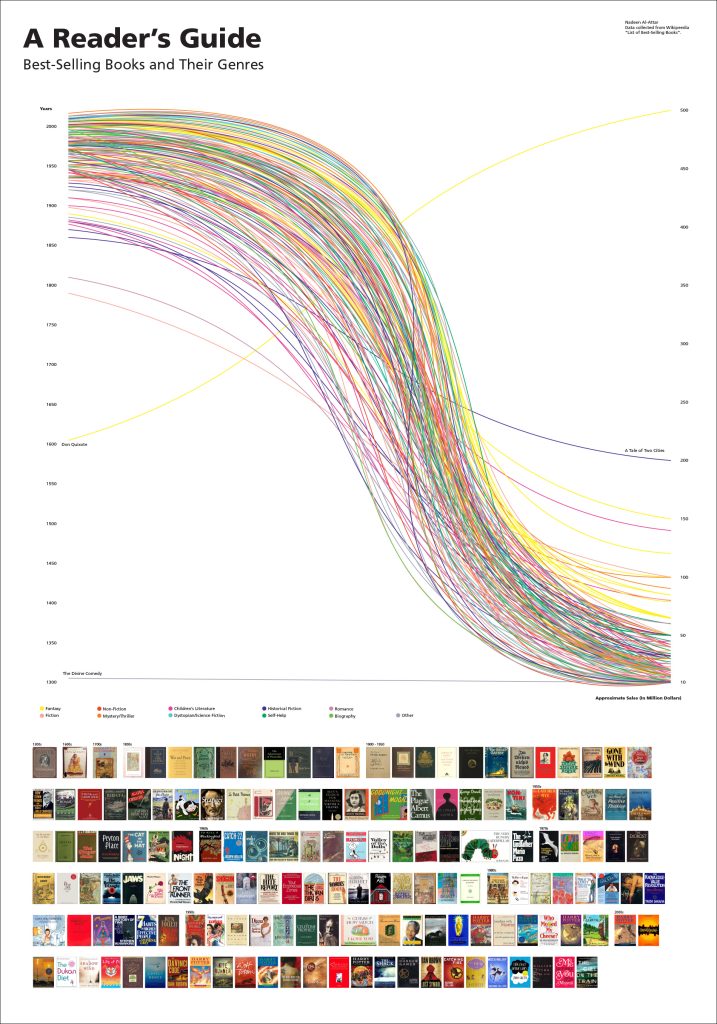
  • Best-selling Books and their Genres – Nadeen Alattar
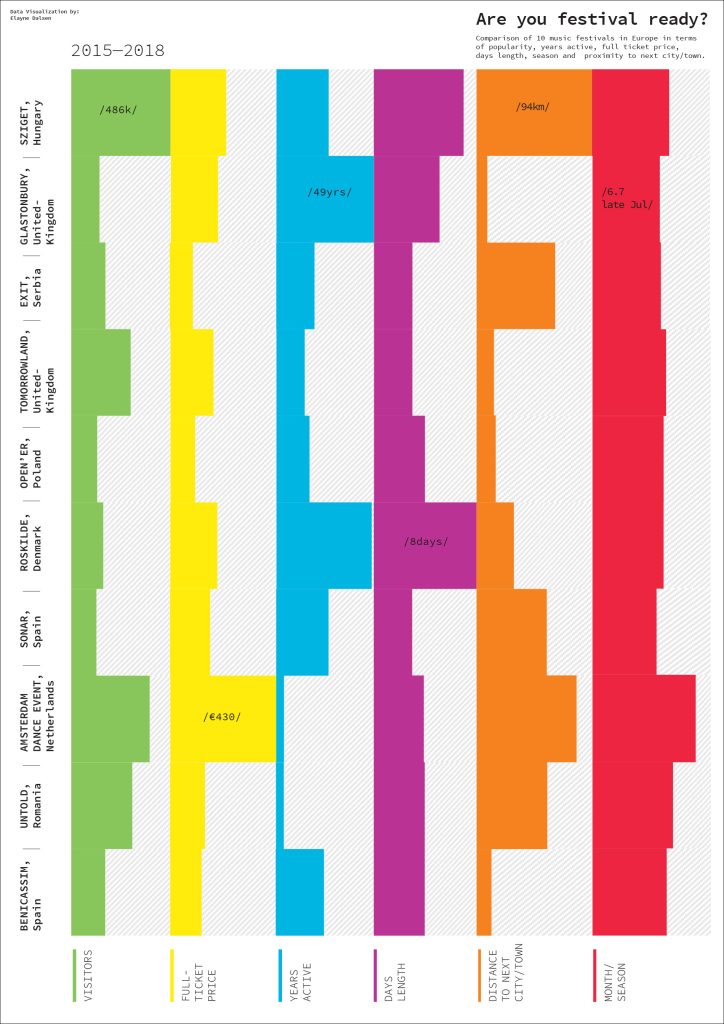
  • Annual Music Festivals in Europe – Elayne Dalsen
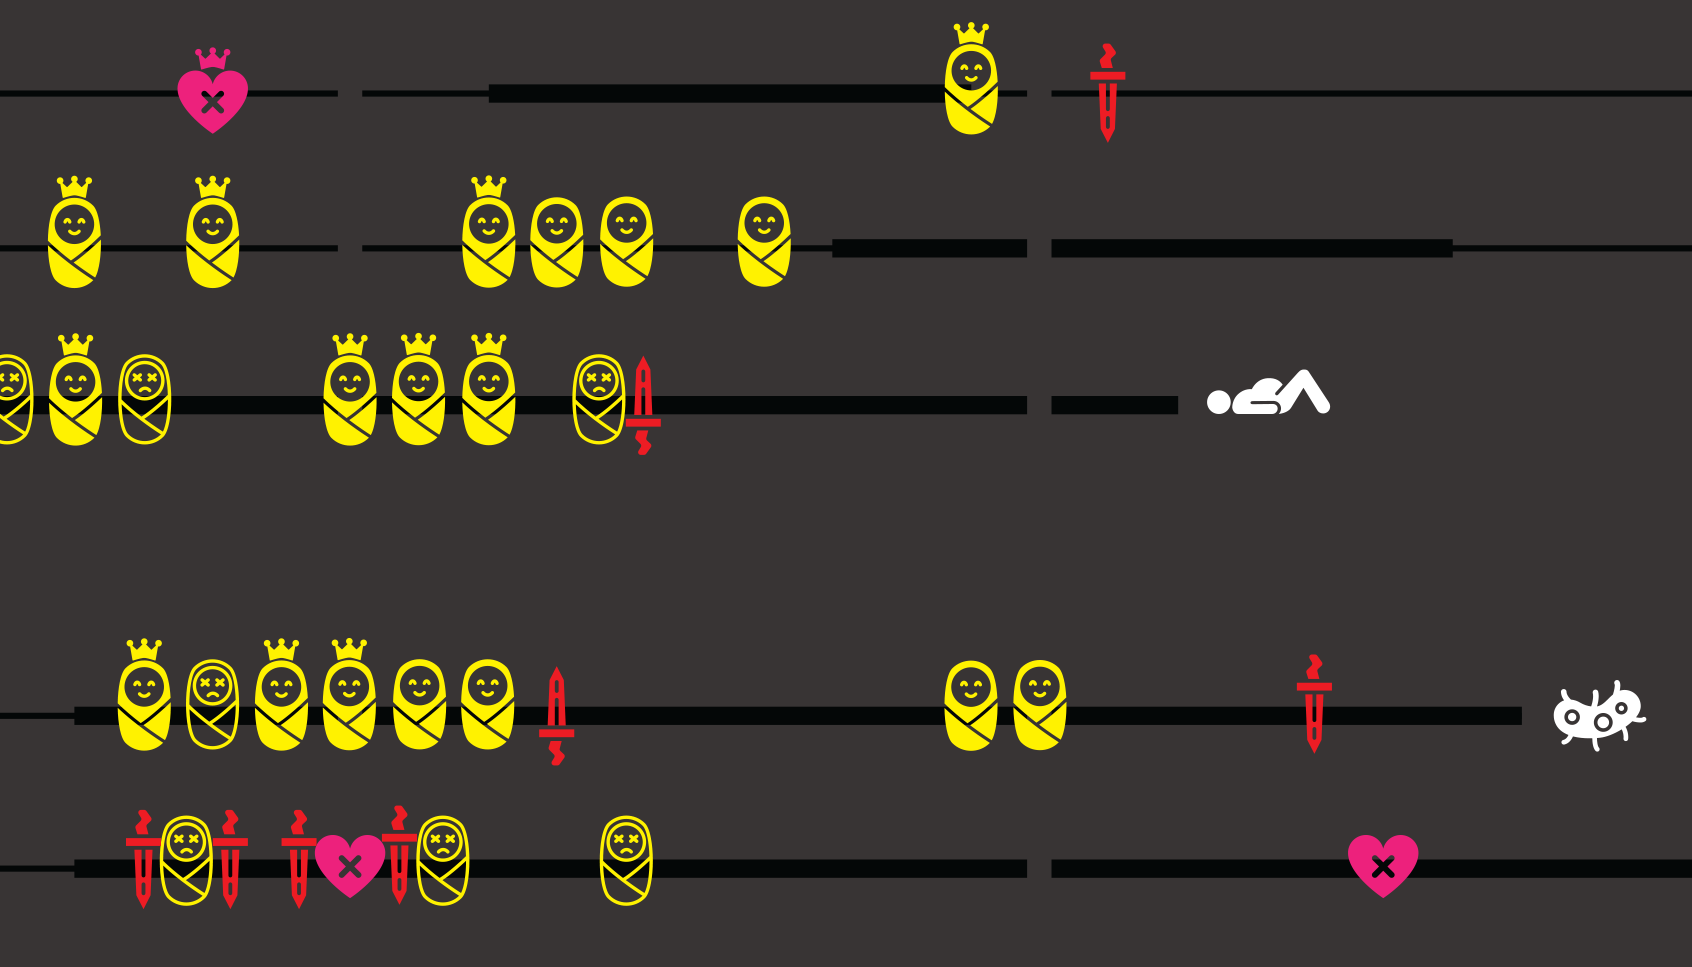
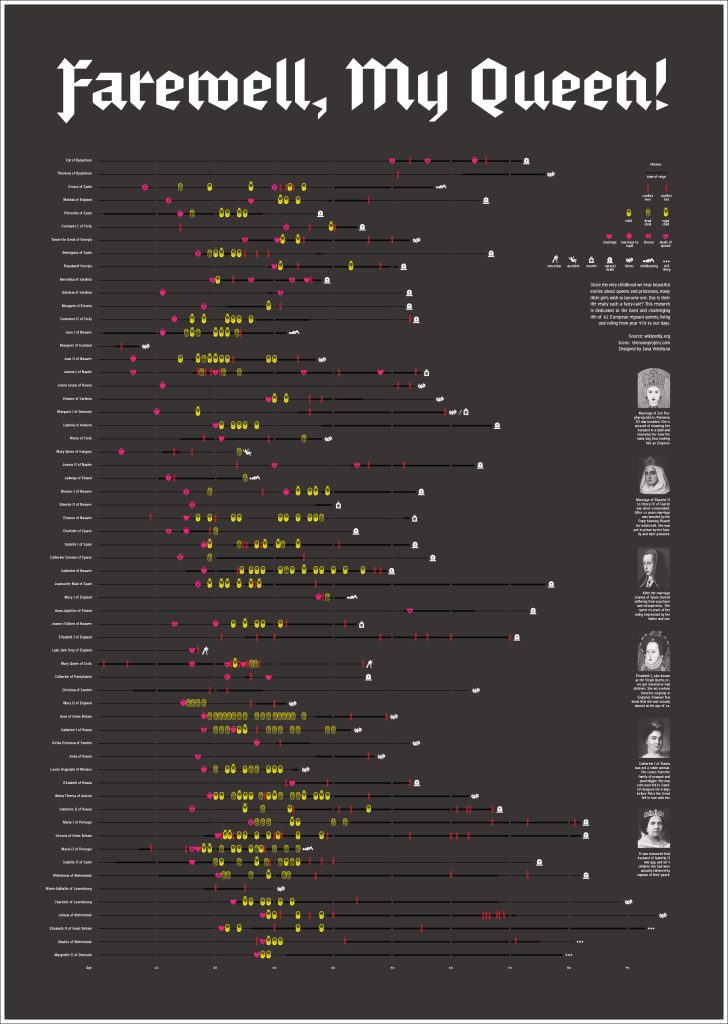
  • Farewell My Queen — The Life and Death of all European Queens – Iana Vekshyna

Berlin International, Visualized

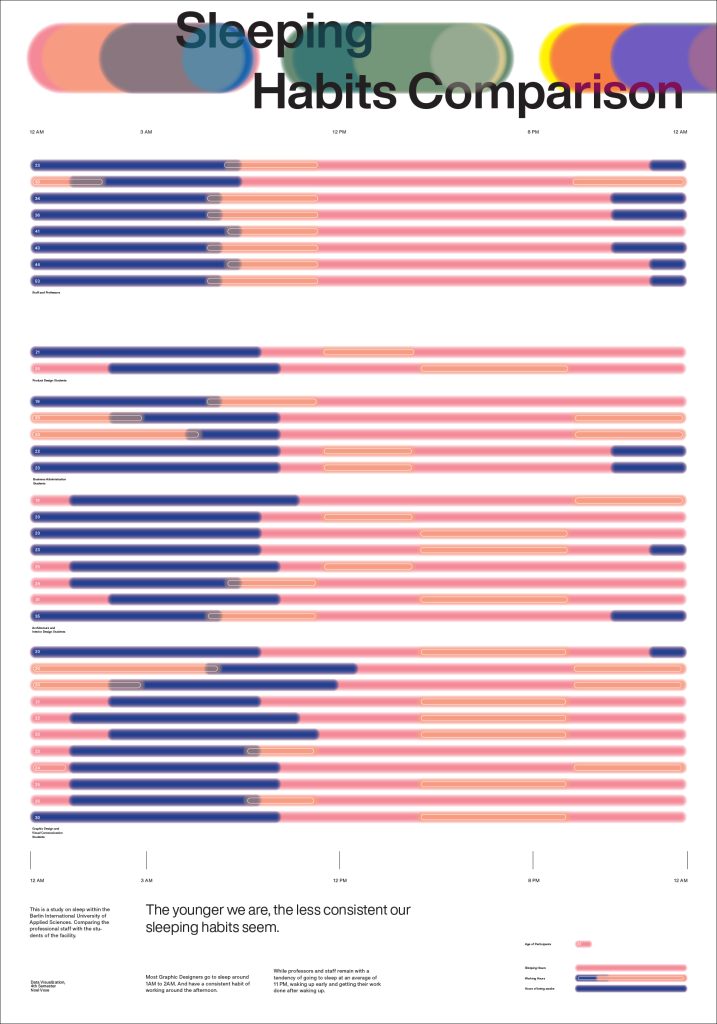
  • Sleeping Habits Comparison / Students of various BI Programs vs Teachers – Noel Vose
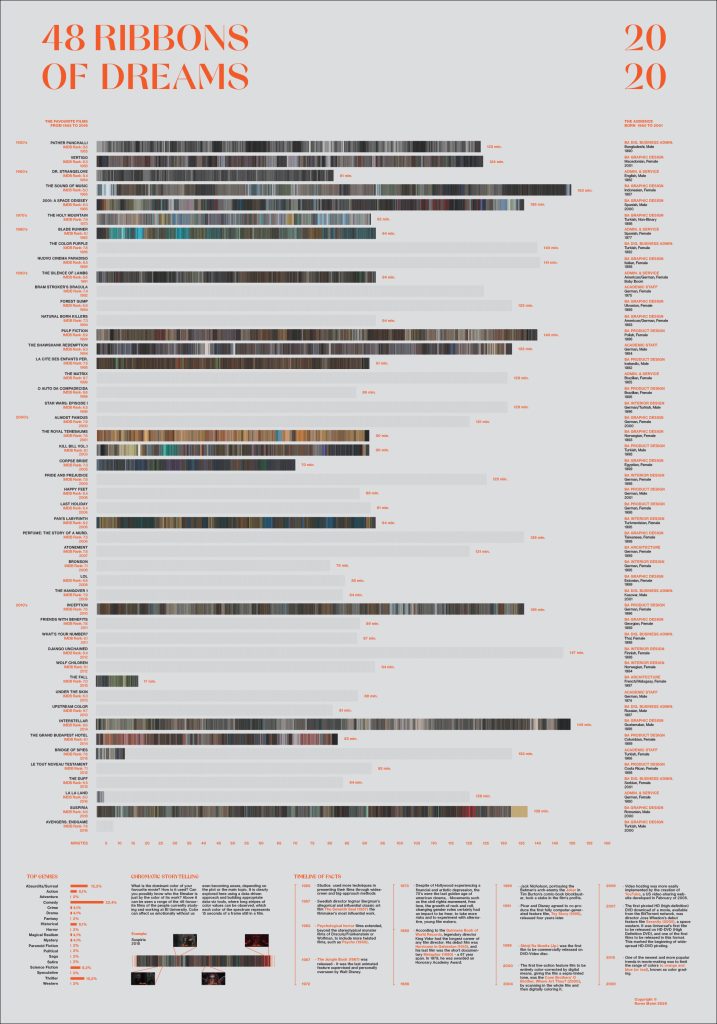
  • 48 Ribbons of Dreams / Movie Favorites of BI Students and Staff – Rares Matei
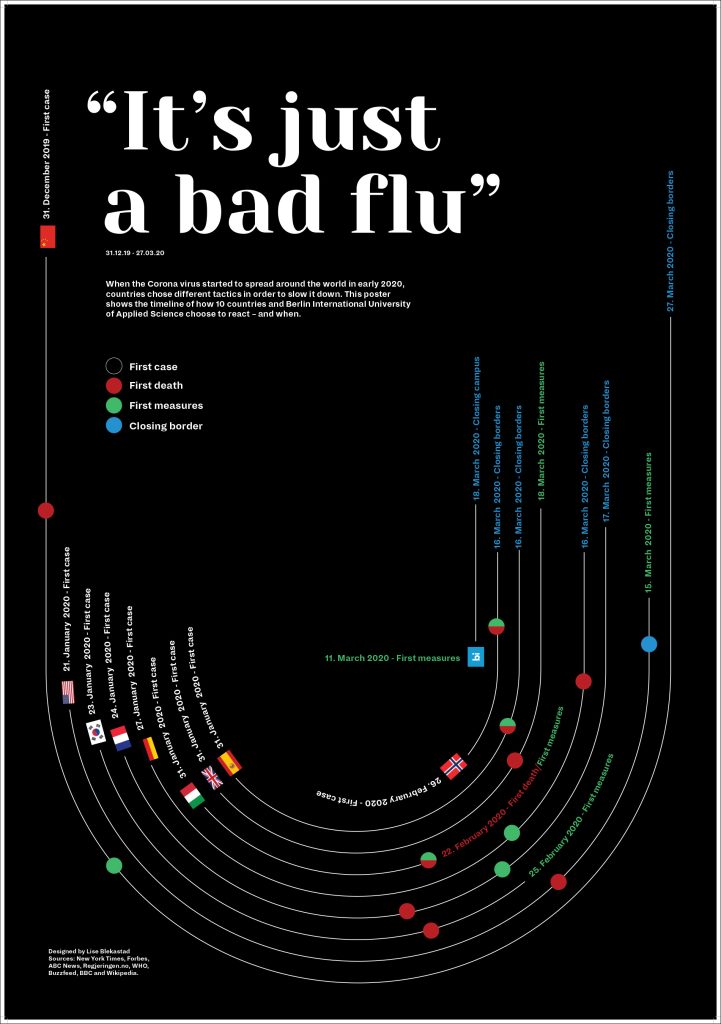
  • It’s just a Bad Flu / Worldwide Coronavirus measures vs Berlin International – Lise Blekastad

Gallery

Whitecliffe University of Applied Sciences.
Legal entity: Whitecliffe Higher Education Service GmbH.

Salzufer 6 · 10587 Berlin

+49 30 81 30 88 00

© 2026 Whitecliffe Higher Education Service GmbH

STATE-RECOGNISED  ·  BERLIN  ·  CHARLOTTENBURG